


How to Read the NFT Market Like a Pro
Why the NFT Market Cap Is Your Most Important Valuation Signal
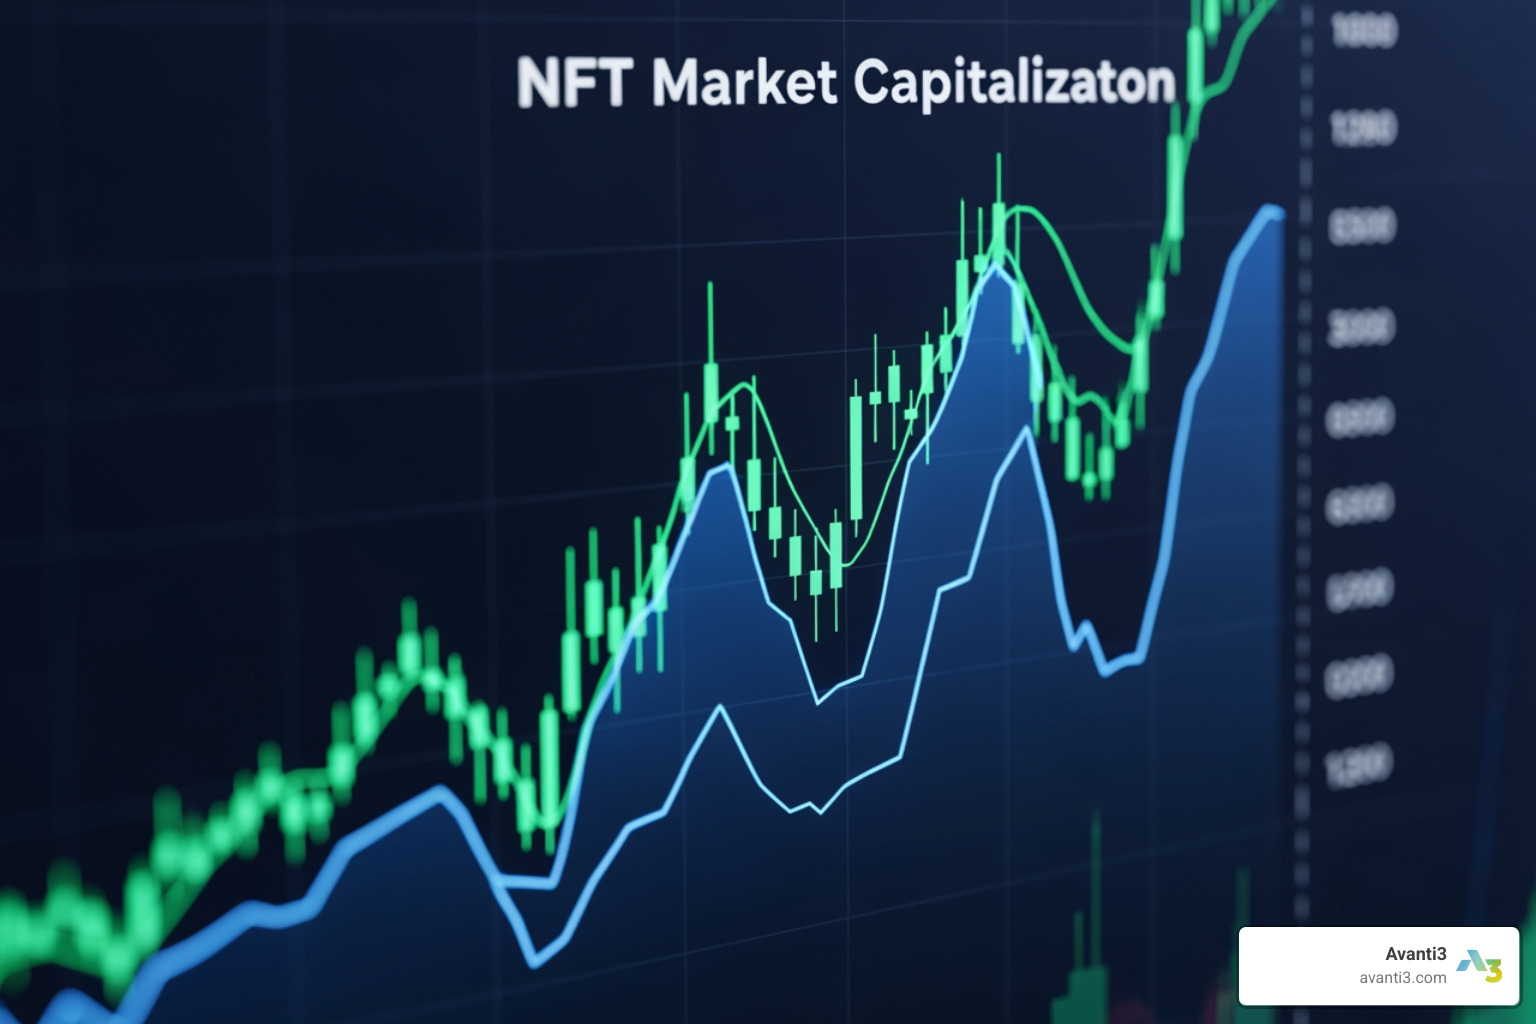
The nft market cap is currently valued at approximately $3.43 billion, and understanding it is the fastest way to gauge the health of the entire NFT space at a glance.
Here’s what you need to know right now:
| Metric | Current Value |
|---|---|
| Global NFT Market Cap | $3.43 Billion |
| 24-Hour Change | -1.79% |
| 24-Hour Sales Volume | $7.01 Million |
| 2025 Peak (January) | $9.2 Billion |
| 2025 Low (December) | $2.5 Billion |
| Q1 2025 Transaction Volume | $1.5 Billion (-63% YoY) |
NFT market cap is calculated by multiplying the total supply of NFTs in a collection by its current floor price — the lowest listed price on the open market. It’s the single metric that lets you compare collections, spot trends, and cut through the noise.
This isn’t just a number for traders. For creators and brands, it’s a direct signal of how much real demand exists for digital ownership in your category.
I’m Samir ElKamouny, an entrepreneur and marketing strategist who has spent years helping businesses unlock new revenue streams — including navigating the rise and volatility of the nft market cap to find real opportunities. In this guide, I’ll break down exactly how to read these signals like a pro so you can make smarter decisions for your brand or project.
Key nft market cap vocabulary:
Decoding the NFT Market Cap: Calculation and Key Metrics
When we talk about the nft market cap, we are essentially looking at the “weight” of a project or the entire industry in the digital economy. Just like the stock market has a total value, the NFT world uses market capitalization to provide a benchmark for success and stability.
At its core, an NFT is a unique digital identifier. It proves you own a specific item—whether that’s a piece of digital art, a virtual sword in a game, or even a deed to virtual real estate. But how do we put a price tag on a collection of 10,000 unique images? That is where the floor price comes in.
The floor price is the lowest amount of money you can spend to “get into the club.” If a collection has a floor price of 2 ETH, it means the cheapest available NFT in that set is being sold for 2 ETH. By tracking this across thousands of collections, we get a clear picture of the global nft market cap.
For brands looking to enter this space, understanding these metrics is the first step. If you are planning to launch your own project, you’ll need a solid foundation. We often help partners navigate this through NFT marketplace development, ensuring the technical infrastructure supports a healthy and transparent market valuation from day one.

How to Calculate NFT Market Cap and Floor Price
Calculating the nft market cap for a specific collection is surprisingly simple, yet it carries immense weight in how investors perceive value. The formula is:
Market Cap = Floor Price × Total Supply
Let’s break that down with a real-world example. If a collection has 10,000 items and the floor price is $500, the market cap is $5 million.
However, it is important to remember that this is a “floor” market cap. It assumes every item is worth the lowest price. In reality, rarer items within the same collection often sell for much more, meaning the “true” value of a collection might be higher than the floor market cap suggests.
| Metric | Definition | Role in Valuation |
|---|---|---|
| Floor Price | The lowest price for an NFT in a collection. | Determines entry-level cost and liquidity. |
| Total Supply | The number of NFTs minted in a collection. | Acts as the multiplier for total valuation. |
| Circulating Assets | NFTs currently available for trade. | Influences supply and demand dynamics. |
| Market Cap | Total value of the collection (Floor x Supply). | Serves as a global ranking barometer. |
For a deeper dive into the technicalities of these rankings, you can explore how NFT market cap is calculated. Understanding this math helps us see why some collections with fewer items but higher floor prices can actually have a larger market impact than massive collections with “cheap” entries.

How NFT Market Cap Differs from Traditional Crypto Valuations
A common mistake we see is people treating the nft market cap exactly like the market cap of Bitcoin or Ethereum. While they share a name, the mechanics are worlds apart.
- Fungibility: Bitcoin is “fungible.” If you trade one Bitcoin for another, you have the exact same value. They are interchangeable. NFTs are “non-fungible.” Each one has unique metadata and a unique ID. You cannot simply swap one Bored Ape for another and assume the value is identical.
- Divisibility: You can buy 0.0001 of a Bitcoin (a Satoshi). In most cases, you cannot buy 0.0001 of an NFT. You either own the token, or you don’t. This makes the NFT market less liquid than the traditional crypto market.
- Valuation Source: Traditional crypto market caps use the “last traded price” multiplied by circulating supply. Since NFTs trade less frequently, we use the “floor price” as a proxy. This makes the nft market cap more sensitive to sudden changes in sentiment.
To see how these differences play out in real-time, you can check the top NFT collections by market cap and compare their volatility to standard tokens.
Factors Influencing Global NFT Valuations
Why does one collection have a market cap in the hundreds of millions while another struggles to stay above zero? In our experience at Avanti3, it usually comes down to five key factors:
- Utility: What can you do with the NFT? Does it give you access to a private community, a game, or future airdrops? Utility is the strongest driver of long-term floor prices.
- Rarity: Within a collection, “traits” matter. A gold-furred ape is worth more than a brown-furred one. While the floor price sets the market cap, the existence of ultra-rare items keeps the community engaged.
- Creator Popularity: A collection launched by a world-renowned artist or a major brand starts with a higher baseline of trust and demand.
- Product Appeal: Sometimes, it’s just about the art. If the visual style resonates with a specific subculture, the demand (and thus the floor price) will rise.
- Community Diversity: A healthy collection has many different owners. If a few “whales” own 50% of the supply, the market cap is fragile because one person selling could crash the floor.
We are seeing these factors evolve rapidly, especially with the rise of augmented reality NFTs, which add a layer of physical-world interaction to digital assets, significantly boosting their perceived utility.
Analyzing Top Collections and Future Market Trends
The NFT market is a “winner-takes-most” environment. A small handful of “blue-chip” collections dominate the total nft market cap. These are the projects that have survived multiple market cycles and continue to hold significant value even when the broader market is down.
As of early 2026, we are seeing a fascinating shift. While 2025 was a year of “correction”—where the market cap fell from a $9.2 billion peak in January to a $2.5 billion low in December—the start of 2026 has shown a resilient rebound, with the total valuation climbing back above $3.3 billion.
This recovery is driven by a flight to quality. Investors are moving away from speculative “profile picture” (PFP) projects and toward collections with established brands and proven secondary market demand. For those interested in how these high-value assets move, studying NFT digital art sales provides excellent insight into the “fine art” side of the market.
Leading NFT Collections by Market Capitalization
When we look at the leaderboard, the names are often familiar, but the numbers tell a story of shifting dominance. The combined market cap of top-tier collections like Bored Ape Yacht Club (BAYC), CryptoPunks, Azuki, and Art Blocks has historically exceeded $6.5 billion.
However, new players are constantly entering the arena. For example, Sports Rollbots recently made waves by entering the top 10 NFT collections by market cap. With a floor price of approximately $5,800, its valuation soared above $58 million, displacing older, more established projects.
We also see unique tokens like APENFT (NFT), which acts as a bridge between world-class artists and the blockchain. APENFT has a market cap of roughly $438.63 million, though its massive circulating supply of 999.99 trillion tokens makes its “per-token” price very small.
It hasn’t all been upward growth, though. In late 2025, the market faced a significant squeeze. You can read more about how the NFT market cap hits 2025 low to understand the pressures of regulatory changes and declining buyer sentiment that led to a 72% decline from the year’s peak.
Blockchain Dominance and Recent Market Rebounds
Where an NFT lives matters as much as what it is. For years, Ethereum was the only serious player in the nft market cap rankings. Today, the landscape is much more diverse.
- Ethereum: Still the king of “blue-chip” NFTs, holding the lion’s share of total valuation and volume.
- Bitcoin (Ordinals): A massive trend in 2025 and 2026. Bitcoin isn’t just for “digital gold” anymore; its Ordinals, Runes, and BRC-20 collections have added hundreds of millions to the global market cap.
- Solana: Known for high speed and low fees, Solana has seen a 26% jump in weekly volume recently, attracting a younger, more active trading community.
- BNB Chain & Immutable: These chains are dominating the gaming and “mass-market” NFT sectors, with BNB Chain showing a 17% growth in volume during recent recovery phases.
The news that the NFT market cap surpasses $3.3B in early 2026 is a signal that the “NFT winter” may be thawing. While weekly sales volumes are still lower than the 2021-2022 mania, the increase in floor prices for major collections suggests that the remaining participants are high-conviction collectors rather than short-term flippers.
Using Data to Make Informed Investment Decisions
If you want to read the market like a pro, you have to look past the hype and focus on the hard stats. At Avanti3, we advise our partners to look at three key data points:
- Trading Volume: A high market cap means nothing if no one is buying. If a collection has a $100 million market cap but only $1,000 in daily volume, it’s a “ghost town.”
- Buyer Participation: In late 2025, unique buyers dropped from over 204,000 to about 135,000 in a single month. When participation drops, floor prices usually follow.
- Sales Velocity: How often are items selling? High velocity indicates a liquid market where you can easily enter or exit a position.
Our mission at Avanti3 is to integrate these Web3 insights with real-world business goals. Whether it’s through NFT engagement tools that reward loyal fans or building custom fintech solutions, we help you use this data to build sustainable digital ecosystems.
The nft market cap is more than just a number—it’s a heartbeat. By monitoring it, you can see when the market is overextended and when it’s undervalued. As we move further into 2026, the focus is shifting from “What is the price?” to “What is the value?”
Are you ready to build something that stands the test of time in the digital economy? From strategy to execution, we are here to help you lead the way.
Launch Your Project with Avanti3: NFT Marketplace Development